


![]()


Jun 4, 2020 | EWAN ROSIE


In recent weeks we bet that almost everyone reading this has had a moment of doubt, a niggling second of wondering whether everything is going to be okay in the long run. We believe in a long-term investment approach and these seconds of doubt can easily be counteracted by our evidence-based philosophy. But we’re not asking you to take our word for it… let’s look at some evidence that will make sure the only pick ‘n mix choice for you will be when the cinemas reopen!
A common scenario that people ponder is ‘what if I move into tech stocks and pharmaceutical companies – surely these sectors will do well’. Or they might try to pick out specific companies that appear likely to thrive in the future. There are two main challenges here:
1.You won’t be the first person to have thought this and these views will already be reflected in how markets are currently behaving
2.In making such concentrated bets you have a high chance of being wrong and missing out on the companies that actually end up driving future returns. Remember, 30 years ago Amazon did not exist!
To get a feel for what risk on such a concentrated level looks like, we can dig around in a vast bank of US stock market data and turn our attention to the CRSP database (the Centre for Research in Security Prices). One study* of this data reveals some surprising and useful findings. Whilst evidence supports the notion that stocks – in aggregate – outperform cash over longer periods of time, a forensic look at individual stock returns tells a very different story. Here are some of the findings:
– The average time that a stock was listed on the CRSP database between 1926 and 2015 was only seven years. That’s not long.
– More than half delivered negative returns. The average lifetime return on any single stock was -3.7% p.a. That’s not good.
– 26,000 stocks appeared in the CRSP database since 1926, yet only 36 stocks survived the entire 90-year period. That’s not many.
– $32 trillion of wealth was created, which was generated entirely by the top 1,000 companies, representing less than 4% of the total number of companies listed over time. The top thirty firms (0.1% of all stocks) accounted for around 30% of the total stock market’s wealth creation. That’s pretty concentrated.
The author of this paper states:
‘Non-diversified portfolios are subject to the risk that they will fail to include the relatively few stocks that, ex-post, generate large cumulative returns. Indeed the results help to understand why active strategies, which tend to be poorly diversified, most often lead to under-performance.’
At times like this – and in fact across all time periods – it makes enormous sense to remain highly diversified – avoid missing out when companies such as the next Exxon (the firm that has added most value to the US market ever), Apple or Amazon are coming up through the ranks.
Simply looking at the changes in the top ten US firms by revenue in 2000, 2010 and 2020 says a lot:
Top ten US companies by revenue over time (2000, 2010, 2020)
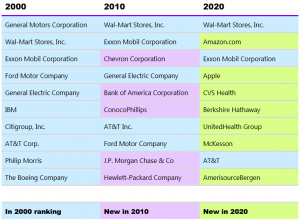
Correctly picking which few companies are going to drive stock market returns over the next decade or two will not be easy, or likely – instead you should capitalise on returns by having a broadly diversified portfolio.
Remember, your investment approach should change with your long-term financial goals, not the companies who make the top ten this week!
Past performance can’t guarantee what investments will do in the future. The value of a portfolio can go down as well as up, so there’s a chance you’d get back less than you put in.